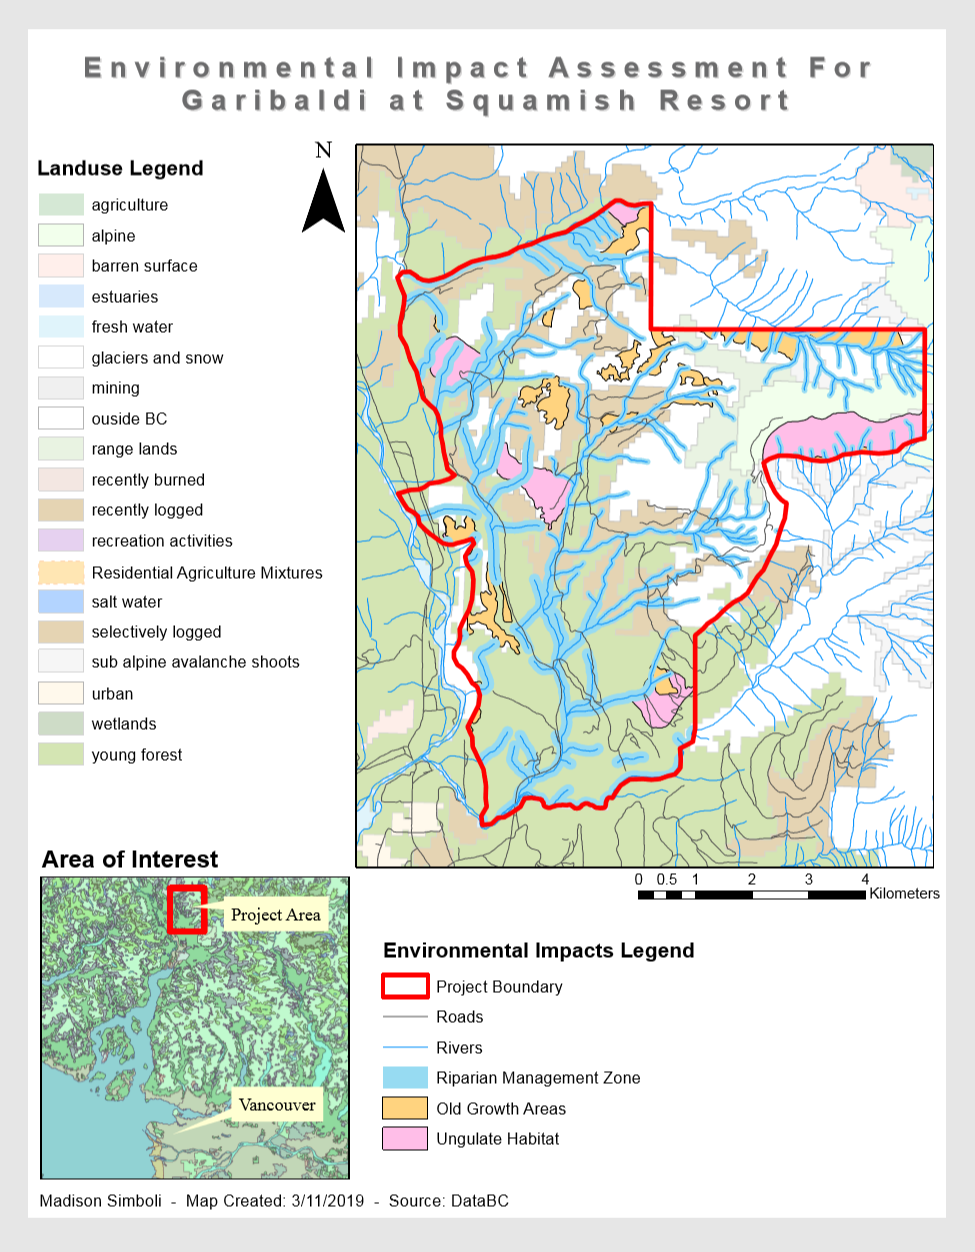
I started the analysis of the potential Garibaldi at Squamish ski resort site by first researching the potential natural resources that could be affected by the establishment of this resort. After gaining this information, I collected data layers from DataBC about the protected old growth forest areas as well at the winter range of ungulates, mammals such as deer. Additionally, I obtained a layer mapping out the different rivers in and around the projected site. I created a variable width buffer around the rivers. This width buffer is one of 50m above the snowline (600m), because fish are less like live at this elevation and it is a width of 100m at those streams and rivers that fall below the 600m elevation level. This buffer area represents the space which is protected for fish habitat and riparian area. Other data layers that were collected included the proposed project boundary, a general land use layer, a parks and protected area boundary, 20m elevation contours, a digital elevation model and a layer with roads.
Next, I went through and compiled this data onto two maps. One showing the proposed project areas without hill shading of the mountainous area, and one with. With these layers in place, I was able to answer some important questions regarding the development of the Garibaldi at Squamish resort. The first being the concern of there being enough snow. My analysis showed that 68.22% of the proposed project area is within the snow boundary area, a elevation higher than 600m. My analysis also looked at what percentage of the proposed project area would fall within mule deer/mountain goat winter habitat and old growth forests. This was found to be 7.89% and 6.78% respectively. Additionally I found that 28.43% of the area in the proposed project boundary would contain fish habitat/riparian areas or within fish bearing streams. By combining all of these protected natural resource layers/areas in ArcMap using the union tool, I found that a total of 38.63 % of the proposed project area contains protected areas.
A source of error was found by trying to add together all of the protected areas rather than using the union tool in ArcMap. When all of the protected areas percentages were added together manually, I calculated that 43.1% of the proposed project area contained protected areas. However, this calculation didn’t account for the overlap between many of the protected layers. The answers are different because of rounding and overlap that is dissolved. In further research there may need to be considerations taken for endangered plant and animal species in the area that could be affected by construction. There also could be some considerations taken for the air quality of the fragile alpine environment. The increase in traffic and there for greenhouse gas emissions to that area could impact some species.
In this lab I was also able to better understand the Project on the Fly feature in ArcMap. Project-on-the-fly, allows you to combine layers with different coordinate systems which leads them to align with each other. They are in the same coordinate system for display purposes in this sense. The Arctoolbox Project tool has to be done individually for each shape file. If I just wanted to quickly make a map for display purposes only, then projection on the fly works fine as it can be exported just fine as a pdf. If I was creating a personal geodatabase to consistently update then I would want to use the project command to assign the projected coordinate system.
( EIA3Dhillshade pdf links to a similar map to EIA, but with hill shading to show a more accurate representation of the area)