If you were to do a Google search for storm surge this is the result you would get, "a rising of the sea as a result of atmospheric pressure changes and wind associated with a storm." A recent hurricane which took place in the Carolinas had a storm surge of around 4 meters! The link below displays images that help in understanding this.
https://globalnews.ca/news/4449896/hurricane-florence-storm-surge-height/
A storm surge in the Vancouver area could lead to multiple disastrous impacts for the city. The objective of this lab was to analyze these impacts in a visual manor in order to better understand the implications of a storm surge.
The first map I produced (low elevation) displays the different elevations in the Vancouver metro area in meters. The various elevations throughout the Metro Vancouver area are displayed by the different colors. By referring to the key on the left hand side viewers are able to see the lowest elevation areas, those that would be most affected by a storm surge. The next map (flooding) outlines the highest potential flooding areas in pink, places affected if water levels were to rise by 1 meter. The third map (roads flooding) displays the major roads that would be affected by the meter of potential flooding. I mislabeled the road in the legend by their road number, rather than type. To clarify, expressways (road type 2) are labeled in red and the major highways (road type 1) are labeled in black, they appear on the map where they would be affected by a meter of sea level rise. From this analysis I found that:
- 105.9 km of Expressways (road type 1) would be potentially affected by flooding
- 63.6 km of Primary Highways (road type 2) would be potentially affected by flooding
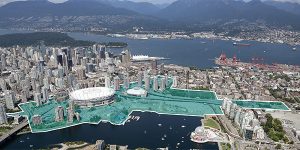
The final map (roads flooding) depicts the False Creek Area in Vancouver. This is the future site of the new St. Paul's hospital, which is the tan colored area labeled in the legend on the map.
One thing to consider in this project is the resolution of the DEMs in the maps. The resolution of this data is 25m by 25m, meaning this data is too coarse. 25 m by 25 m is a large amount of area when trying to determine what a single meter of sea level rise will do. It is accurate enough for an overview and our analysis here but it is not good enough if we were trying to do a serious geographic analysis for maybe the city. I believe that this data is relatively accurate enough for scale and area as it is one of the standard Datums and Coordinate systems for North America which should be used for Vancouver.
The four maps attached below were produced using ArcGIS. Data was collected from these sources: Statistic Canada/Census Canada: - shoreline - UBC geography department file for Metro Vancouver Census Metropolitan Areas (CMA) False Creek Flats Data: http://vancouver.ca/home-property-development/new-st-pauls.aspx and City of Vancouver: http://vancouver.ca/your-government/open-data-catalogue.aspx QazaQ!`